


Are you struggling with the fact your GA4 data doesn’t stretch back as far as you’d like?
Perhaps you're struggling to join up your UA data that stopped dead in July last year with your GA4 data. Or maybe you’ve noticed real significant discrepancies between your GA4 sessions and your UA sessions?
If so, then this Google Sheet, is for you! We’ve put together a sheet that helps you blend together your existing GA4 data with historical UA data. Our Historic GA4 Sessions Generator creates backdated, estimated GA4 sessions going back to the starting period of your UA data.
This allows you to maintain a consistent analytics history which is really useful for reporting, forecasting and general data analysis.
Make a copy and download the sheet here
Why is this tool required?
In July 2023, Google phased out Universal Analytics (UA) and transitioned to Google Analytics 4 (GA4). With the discontinuation of UA, many found themselves missing historical data, as they hadn't implemented GA4 tracking going back that far.
This may lead to challenges, such as:
- Generalised reporting - If you want to examine session data over time, you are limited to only the period where you have GA4 set up.
- Forecasting and Causal Impact testing - For these, you will generally require at least a year or two of data for the model to understand seasonality and yearly trends.
- Comparative analysis: Comparing current performance with historical performance becomes challenging. For folks who were late to set up GA4 tracking, it can be difficult to draw direct comparisons between past and present performance metrics.
So what’s the problem with just simply joining together UA and GA4 data?
It may seem easy enough to just get your historical UA data and blend it with your GA4 data with a date of your choosing, but there is one pretty fundamental problem. Even with early GA4 setup and concurrent running with UA, you’ll notice discrepancies.
This discrepancy comes from the fact that 'sessions' means different things across UA and GA4 with their differing capabilities in tracking user activity across various devices and platforms.
The solution? Generating backdated “predicted” GA4 sessions.
How does this Google Sheet generate “predicted” GA4 sessions?
This sheet generates these backdated, historical GA4 session numbers by looking at the average proportional difference between UA and GA4 sessions for the periods where both are tracked simultaneously.
From there, the historical GA4 sessions are calculated by multiplying the known UA sessions by this ratio and “voilà!” you have your backdated GA4 sessions.
Benefits
- This sheet is straightforward to use and is based on simple calculations.
- All calculations and data are handled in Google Sheets as opposed to a colab etc (and who doesn’t love Google Sheets?)
- The visualisations allow you to see how the backdated GA4 sessions compare to:
a) The recorded UA sessions
b) The recorded GA4 sessions.
Limitations
- This does require having a period where both GA4 and UA sessions are tracked simultaneously (the longer the better!)
- These backdated GA4 sessions are estimates based on the proportional difference between known UA and GA4 sessions.
- This sheet does require you to pull in the UA and GA4 data. Though you can use the Google Sheets Add Ons to help with this.
How do I use this tool?
This section provides a step-by-step guide of how to use the sheet.
Step 1: Make a copy of the Google Sheet
You can make your copy of the Google Sheet here.

Step 2: Navigate to “UA - Raw Data tab” to provide Universal Analytics Sessions data.
You will need to provide historical Universal Analytics data in the “UA - Raw Data” tab.
This sheet is ideally designed to work using an output from the Google Analytics Spreadsheet Add-On with the data starting from row 15 (though can enter it in manually).
For this sheet to work, Column A should be Date and Column B Sessions.

This data can be inputted by either…
Option A - Using the Google Analytics Spreadsheet Add-On. This is the easiest option.
This requires you to have downloaded the Add On, set up the Report Configuration using the template below and then run the report. This will auto-populate the “UA - Raw Data” tab.

Option B - Manually copying and pasting in the sessions data from the Google Analytics interface or from a Looker Studio Report.
Important notes
- You will need to ensure that the data is formatted the exact same way as the existing sheet which includes:
- The data starting at row 15.
- The data column is in the format yyyy-mm-dd.
- Column A being Date and Column B being sessions
Step 3 - Navigate to “GA4 - Raw Data tab” to provide GA4 Sessions data
You will need to provide GA4 data in the “GA4 - Raw Data” tab.
This operates in a very similar way as the UA sessions data, ideally using a similar output from a Google Sheets add on. In this case, the Add on is Adformatics Google Analytics 4 Google Sheet Add On. with the data starting from row 15.
For this sheet to work, Column A should be Date and Column B Sessions.

This data can be inputted by either…
Option A - Using the Adformatics Google Analytics 4 Google Sheet Add On.
This requires you to have downloaded the Add On, set up the Report Configuration using the template below and then run the report. This will auto-populate the “GA4 - Raw Data” tab.

Option B - Manually copying and pasting in the sessions data from the Google Analytics 4 interface or from a Looker Studio Report.
Important notes
- You will need to ensure that the data is formatted the exact same way as the existing sheet which includes:
- The data starting at row 15.
- The data column is in the format yyyy-mm-dd.
- Column A being Date and Column B being sessions
Step 4 - Review the outputs
Once you have loaded in the UA and GA4 data, the Google Sheet will do the magic in the background.
If you want to see what’s going on in the background, see “How do these calculations work?” section.
There are a number of outputs which allow you to compare how the sessions compare between the different sources.
The raw numbers
The first output to have a look at is the tables which contain the raw data broken down by date. This includes:
- UA Recorded Sessions - These are the known UA sessions.
- GA4 Recorded Sessions - These are the known GA4 sessions.
GA4 Sessions: Recorded + Backfilled Estimates - These combine the known GA4 sessions with the “predicted” backfilled GA4 sessions. These numbers are calculated using the average ratio between UA and GA4 sessions for the period where there is the overlap.

Comparing UA Sessions To GA4 Sessions
This section allows you to see the proportional difference (or ratio) between the GA4 sessions and the UA sessions.
The is broken down into:
- Classic Average - This is the average of the proportional difference between the GA4 sessions and UA sessions throughout the whole time period.
- Weighted Average - This is the average of the proportional difference between the GA4 sessions and UA sessions throughout the whole time period but this time weighted by the recorded GA4 sessions. This means that the average is going to be more impacted by days with higher sessions recorded.

By default, this is set to use the Classic Average, but this can be updated in the ‘[HIDDEN] Calculations’ tab.

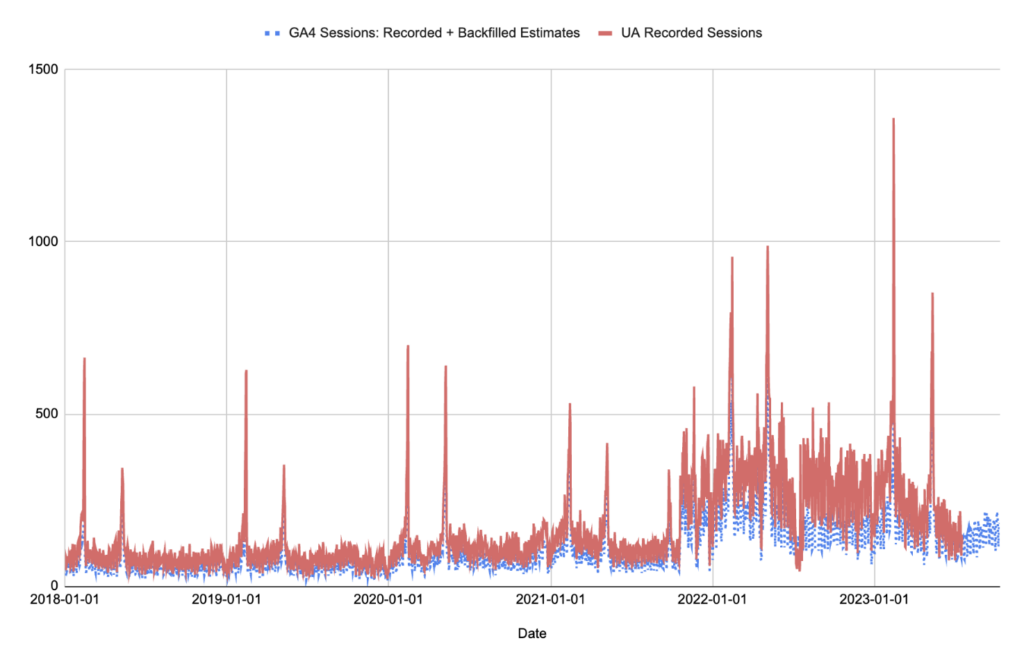
"GA4 Total: Recorded + Backfilled Estimates" vs UA Recorded Sessions
This graph allows you to compare how the GA4 Sessions (including the backdated “predicted” GA4 sessions) compare to the recorded UA sessions for periods.
This allows us to compare how GA4 sessions generally compare to UA sessions - you’ll often see that one is consistently higher than the other.

Recorded GA4 Sessions vs Recorded UA Sessions
This graph allows you to compare how the known GA4 Sessions compare to the known UA Sessions. You’ll most likely see that UA Recorded Sessions are cut off at a specific point, before just GA4 sessions are recorded.

Recorded GA4 Sessions vs "GA4 Total: Recorded + Backfilled Estimates"
The graph displays the Recorded GA4 sessions (green) and allows you to compare them with how the backdated GA4 sessions look.
This enables you to see when the transition takes place from recorded to predicted which is useful - especially when it comes to forecasting and adding regressors.

GA4 Total: Recorded + Backfilled Estimates - Mapped Over Time
The graph displays the main data and output that you’ll want from this Google Sheet which is the Recorded GA4 Sessions alongside the backdated GA4 Sessions.
The surrounding graphs are primary there to provide the context to these final figures,

How do these calculations work?
There are six key stages in generating these figures:
- Step 1 - Generate the earliest Start Date and End Date for the GA4 and UA data.

- Step 2 - Use these start and end dates to generate a date range from the starting point of the UA data, to the end point of the GA4 data.
For those interested, SEQUENCE is the magic formula to be able to do this.

- Step 3 - Pull in the UA and GA4 data for each of the days in the date range.

A simple VLOOKUP is all that’s used here with an IFERROR to catch the gaps.
- Step 4 - Calculate the average proportional difference between UA and GA4 sessions (we’ve done this as a weighted average, and just a classic average to provide several options.)
The first step here is calculating the proportional difference for each day between the UA and GA4 Sessions which I’ve done using an ARRAYFORMULA.

The second step is then using this column to generate the different averages.

- Step 5 - Multiply the historic UA sessions by the calculation by the avg ratios of UA sessions to GA4 Sessions to generate our backdated, predicted GA4 sessions numbers.

We can then decide which average we’d like to use, using the checkbox which dictates which column populates the final “GA4 Sessions: Recorded + Backfilled Estimates” column.

- Step 6 - Once we have generated these numbers, we are then able to pull these final figures into the final Outputs page to generate our graphs and final GA4 Sessions with the predicted backdated sessions.
Final takeaways
This tool is a practical solution for bridging the gap between Universal Analytics and Google Analytics 4. Not a perfect solution, but a way of filling the potential void in data using a somewhat more intelligent approach that just pulling in GA4 and UA session data in together.
Reach out to me @da_westby on X (formerly known as Twitter) to let me know what you think.