Welcome to the second Marketing Innovation Pulse newsletter. I'm Dave, Senior Data & Insights Consultant at Aira, and part of the innovations team here at Aira.
The main focus of this newsletter is on forecasting. More specifically, SEO forecasting.
With marketing budgets increasingly scrutinised, it’s never been more important to be able to make predictions about what value you’re able to bring (especially as an agency). We’ve spent a lot of time thinking about this… and working on a solution.
This newsletter will give you a bit of an insight into that thinking, as well as what else we’ve been up to.

What we’ve been reading
Unsurprisingly, there’s still a fairly heavy 'Machine Learning' lean this month, but thankfully many of the big tech companies are making moves in one way or another, which means a bit more variety in our reading list!
- We've been reading articles about Perplexity.ai, an interesting ChatGPT alternative, which is meant to be more concerned with factual accuracy and includes embedded links to sources as standard.
- A short thread from Barry Adams about newspapers and zero search volume keywords.
- The announcement about Google Product Studio which could, among other things, help advertisers grab your products out of existing images and put them on a totally different background.
- Canada is preparing to pass a law that makes Facebook pay news sites to distribute their content. In response, Facebook is preparing to stop showing news sites in Canada (starting with a test on 5 June). We’re not sure quite how this will pan out but it’s interesting to watch all the same!
- A fascinating, in-depth article looking at accountability in artificial intelligence. This is likely to be a topic we’ll be hearing and discussing a lot about moving forward.
What we've been doing
- Aira was welcomed as part of the HubSpot Partner Advisory Council.
- We announced an internal tool that generates Google Sheets formulas based on a description of what you want to do.
- After Google I/O, Paddy shared his thoughts on the latest developments in search, and our search teams shared their thoughts about how AI is likely to change search.
- We tried out 'Baby AGI', which claims to take complicated instructions, build a plan and complete the plan based on making multiple OpenAI API calls. Honestly? We found the results underwhelming.
- We also tried out 'Dalai' a Large Language Model (like GPT) that you can run on your laptop. Interesting, but so incredibly slow that it’s not really useful for much other than research, particularly given how cheap GPT is.
What we've been thinking - the key challenges in building forecasts, and how we approach SEO forecasting
With marketing budgets receiving greater scrutiny within a tougher economic landscape (certainly in the UK), businesses are increasingly focused on how efficient they can be with their marketing spending.
When speaking to different organisations, we’ve noticed an increased emphasis on this question:
“If I were to invest x, what would my return be?”
Generally, SEO professionals can be reluctant to forecast precise numbers (and consequently be accountable for hitting those numbers), as there are many external factors that can impact traffic.
These factors include core algorithm updates from Google, the introduction of new SERP features (especially with the AI changes that Google is planning) and other external factors that can all impact the traffic, conversions and ultimately, revenue.
At Aira, though, we understand that forecasts are crucial to making business decisions, so we’ve put a lot of thought into how best to estimate sessions, conversions and revenue.
In this post, we’ll explain some of the main challenges of forecasting and the strategies we use to handle them.
There are three crucial elements of a forecast
- Business relevance
- Adaptability
- Acceptable degree of accuracy (and inaccuracy communicated clearly)
Business relevance
Each business is unique, and as a result, each website is going to be distinct as well, with varying seasonal demand, conversion rates, average order values and timelags between people visiting the site and the business making money.
If we were to compare an ecommerce website selling shoes with a B2B SaaS company specialising in bespoke ERP software, the levels of traffic, conversions and seasonality will differ wildly.
For the ecommerce website, 90%+ of the website pages are likely to be transactionally focussed (i.e category pages or product pages) and the time between someone visiting the website and then converting is likely to be relatively small, with a substantially lower average order value than the SaaS company.
On the other hand, for a B2B SaaS company, the site is likely to have far more of a mix of informational content, alongside some more commercially focused content. Both of these types of content will have different conversion rates and time lags from an initial visit to the site to the business making money.
As a result, the forecast needs to be able to cater to these different businesses and the way in which they drive traffic and make money.
Adaptability
Forecasts need to be adaptable to the different scenarios.
In an ideal world, a forecast would just require a click and away we go, but in reality, there needs to be a lot more thought that goes on in the background.
Let’s say, for example, that you’re forecasting conversions for an ecommerce site and you’re initially going to focus on improving CRO. You’d want to run the forecast with conversion rates set at the current level, but also run the same tests with an improved conversion rate and compare the two.
The key is asking the right questions and being able to cater to the forecast accordingly.
When it comes to forecasting organic sessions, the key levers we can pull are predominantly centred on improving existing content, producing new content and improving the technical state of the site, and it’s useful to be able to map out different scenarios.
Some of the questions we may ask are:
- If we were to prioritise technical health first, what impact is that going to have on existing content?
- Would we be better focused initially on building new content or optimising existing content (i.e where is there greater opportunity)?
- How will different budgets allow us to do different levels of work - and what consequent impact will that have on the bottom line?
Acceptable degree of accuracy (and inaccuracy communicated clearly)
Forecasts are seldom going to be bang on the money, but a forecast should at least be in the right ballpark.
This greater accuracy comes from:
a) Using historical website data and pattern-based forecasting.
b) Making the forecast bespoke for the specific business and the type of website they have, their conversion rates, lags, average order values, and the types of customers they are looking to engage and take action on their site.
An important element of the forecast result is also communicating the acceptable degree of accuracy and inaccuracy, and transparently displaying a margin of error based on upper and lower limits.
Challenges of forecasting
A forecast is not a guarantee. It’s a prediction based on combining business intelligence and historical data in order to make estimations about the future.
Using historical data is central in order to understand seasonal trends and the overall trend of traffic, and be able to map these into the future. Historical data is also crucial in terms of understanding conversion rates, average order values, time to go from first session to conversion, etc (otherwise we’d just be picking them out of thin air).
There are two main types of forecasting methods that can be used which have their own relative benefits and drawbacks:
- Pattern-based forecasting
- Opportunity-based forecasting
Pure pattern-based approach
Pattern-based forecasting involves analysing past trends, patterns and relationships in the data to project future results. Examples of this include Facebook’s Prophet and Richard Fergie’s Forecast Forge.
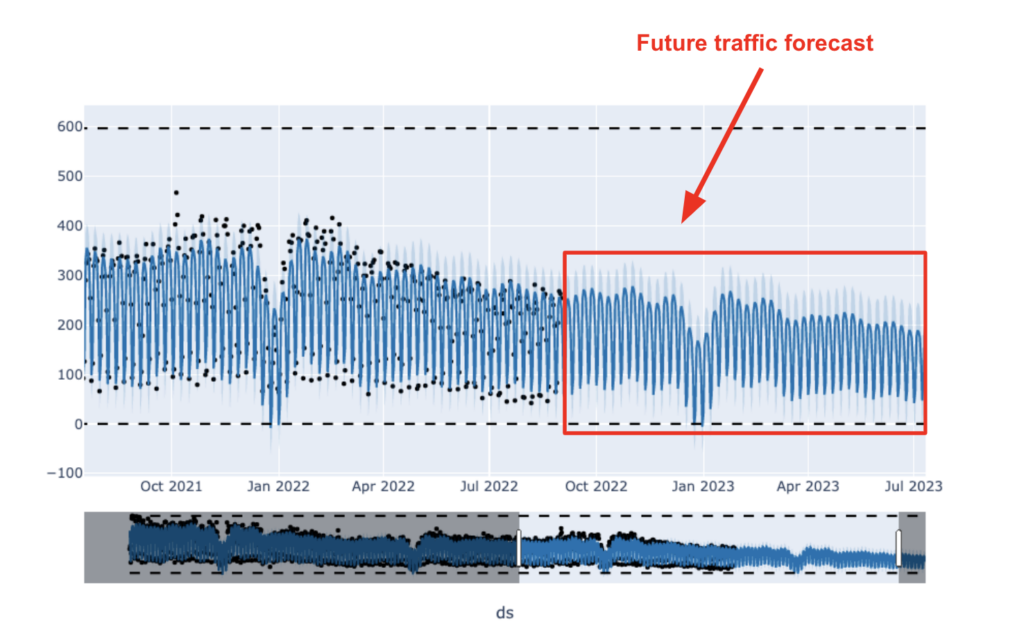
Example output using Facebook’s Prophet.
Benefits:
- The forecasts take in the context of the current site and as a result, understand seasonal variations throughout the year and more effectively map them into the future.
- The forecasts are grounded in the context of what has been achieved and are therefore able to understand and build forecasts that follow the prior trends - whether that be up or down (or stable).
- If the current projections are down, then the forecast will continue to forecast down. The benefit of this is that the forecast is grounded in reality and won’t always assume an improvement, which is more likely with an opportunity-based forecast. This means that the forecasts are likely to be more representative of the reality of site traffic.
Challenges:
- Pattern-based forecasts rely on historical data, so if historical data doesn’t exist the model is limited. The general advice is that you’d want at least two years in order for the model to really understand seasonality.
- The model can’t predict what it hasn’t seen before. If we’re forecasting organic sessions based on significant technical improvements and an avalanche of new content, the model, in itself, would not be able to factor that in.
- The model can be overly optimistic. If a new site has launched and has seen a continuous uplift in traffic in the first year, for example, the model will assume that this will continue regardless of the Total Overall Market.
- The model assumes that you’re not going to make any drastic changes which, if you’re an SEO agency, doesn’t really fit in with the type of work you’d like or in most cases need to do.
- The model doesn’t involve looking at what customers actually want and doesn’t lend itself to any action - instead, it is more focused on predictions based purely on if the status quo continued.
Pure ‘Opportunity’-based approach
Opportunity-based forecasting focuses on making future predictions based on how much of a total potential market we'd be able to own. At Aira, we have the Keyword Navigator which allows us to see the maximum number of additional sessions we could acquire from new or existing pages, and how many pages it would take to build/optimise.
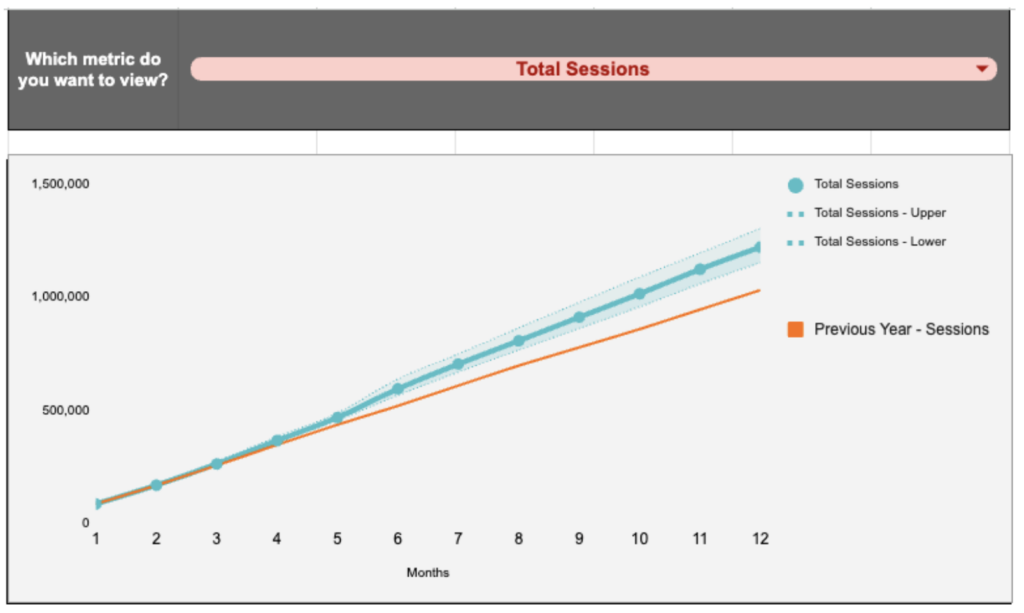
Example output from looking purely at incremental traffic.
Benefits:
- In contrast to the pattern-based approach, opportunity-based forecasts don’t assume that we’ll keep growing forever. There is an understanding built in that there is a total addressable market, and it’s more a question of how much of that market we could own.
- It’s grounded in the reality of the market we’re operating in, whether there’s a huge opportunity for growth or whether there are more marginal gains.
- The model is centred on the customers and the specific metrics they are looking for. That means that forecasts can be more impacted by specific actions (as opposed to overall trends, which is more common with pattern-based forecasts).
Challenges:
- Unlike pattern-based forecasts, this approach doesn’t take into account historical trends. For example, if website traffic has been falling year on year, this model will not factor that in and will assume incremental growth year on year.
- Seasonality is often ignored, which again, means that many opportunity forecasts just show incremental growth instead of being able to understand that in ‘low months’ when your products are less popular you might actually expect a drop in traffic.
- Opportunity-based forecasts have a tendency to be too conservative compared to pattern-based forecasts where there is no upper ceiling. This is due to the fact there is a defined upper limit that your forecast couldn’t surpass.
- Using opportunity forecasts is useful for saying ‘this is what is in reach if you do everything possible this year,’ but it takes more time to look at forecasting monthly projections based on a limited amount of activity per month.
- Another issue with this approach is that lags are not often factored in and as a result, the assumption is that as soon as you start working, you instantly see an uptick in sessions and conversions. In reality, there is a time delay in doing the initial work, getting it implemented on-site and then seeing the benefits.
Aira’s solution to forecasting organic performance
At Aira, we’ve developed a solution that allows us to develop forecasts that rely on combining the overall potential traffic from new and existing pages with historical projections from previous years.
This solution can be broken down into:
- Stage 1 - Calculating the total organic traffic opportunity, for us using the Keyword Navigator. You can also see an explanation of some of the reasoning we use in my blog post here.
- Stage 2 - Breaking down the Total Opportunity into tasks and calculating how many of those tasks we could get done over time based on a specific budget.
- Stage 3 - Adding lags in order to cater for time for work to be delivered, implemented on-site and start ranking.
- Stage 4 - Using seasonality to upweight/downweight impact over time.
- Stage 5 - Making everything formulas and variables in order to allow flexibility and map different scenarios.
- Stage 6 - Presenting the forecasts using confidence intervals.
We’ll cover the most important stages in the sections below.
Taking overall opportunity and breaking down to individual tasks
Total potential traffic numbers are a brilliant feature of our Keyword Navigator Tool, as we’re able to see:
- The amount of traffic we could attain from building new pages and optimising existing pages.
- How many pages it would require to build/optimise in order to hit that overall traffic number.
Essentially, we estimate where we could rank based on current search results and we calculate how much more traffic (and revenue) opportunity we have, per keyword, using Search Console clickthrough curve, current site rankings and on-site conversion rate.
However, it would be a pretty wild assumption to assume this is the total addressable market and we’ll get everything in a year unless you do the maths.
Breaking down the potential opportunity into specific tasks allows us to ground these traffic estimations into actual work, which further allows us to estimate how much additional traffic we could look to drive month on month.
This also allows consultants to keep accountability and make considerations for other tasks such as quarterly reviews, technical audits, and weekly meetings where the team is not going to work on tasks that will directly increase traffic (though are still important).
This also allows us to communicate with clients about the rate that we’ll be moving and consequently what we would be able to do with a greater budget, or if we were to prioritise some tasks over others.
To break the traffic estimate down into tasks, we look at things like:
- Are we already ranking for this search? Are we already ranking pretty well? If so, is it a matter of simple optimisations?
- Are we ranking for highly related keywords? Check out this post for how we use SERP similarity to cluster keywords.
- What’s the technical health of the website?
Factoring in lags
We’d all love to publish a new page, and ‘BAM!’ immediately get traffic and conversions coming to our site straight off the bat. In reality, though, there are a number of time lags that are going to impact how long it takes to start benefiting from new content.
The most obvious of these is the time it takes to actually start doing the content-related work, such as finalising the keyword research, writing the briefs, writing the copy, reviewing the copy and finally uploading the copy to the site.
Another consideration is the time it takes for content to be crawled, indexed and rank which can vary significantly between different websites depending on the technical state of their site and the type of site they have (i.e news publisher or jobs site is generally going to have a quicker indexation time compared to a small B2B site).
So, in all of our calculations, we figure out when we’d expect the work to be done and then work out when we’d expect that work to have an impact based on what we understand about lags for that business.
We also factor in the average time between initial sessions becoming conversions which again significantly differ between different types of websites (i.e. ecommerce compared to B2B SaaS). These all help us to allow more realistic predictions of how additional traffic and conversions are likely to occur.
Seasonality
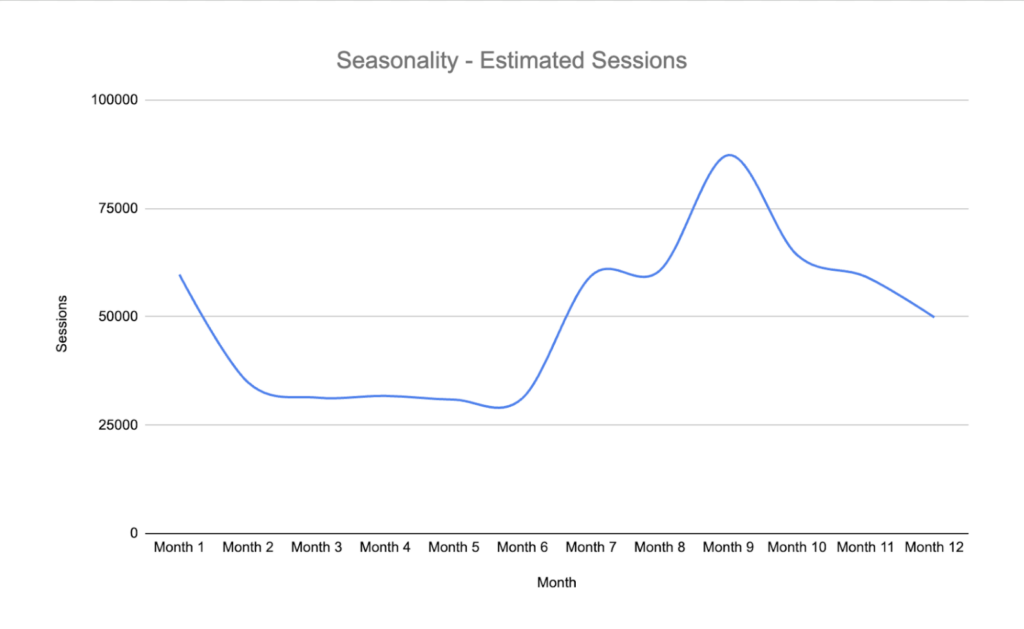
One method for understanding seasonality is simply using last year's traffic, but by using machine learning we create a basic trend line for the coming year, handling seasonality and growth, and smoothing out outliers.
If we just took that as our forecast for the year ahead, we’d run into the issues we mentioned above about pure pattern-based approaches. So instead, we figure out the day-by-day trends and use them to upweight/downweight our impact estimates. If weekly and monthly seasonality shows that a day is typically 50% lower than average, we take our impact estimates for that day (based on Step 2) and drop it by 50%. The same approach works for a steady upward/downward trend over time. This offers all the benefits of pattern-based forecasting but is grounded in the reality of the actual opportunity a business has!
One reason this is important is that prioritising work earlier may well pay dividends if the site is in good shape by the time a high month rolls around. This may be through prioritising content-focused or technical work earlier, or even pulling budget forward in order to capitalise on busier periods.
In the example below we can see that Month 8 is when this search starts to drive a lot of the traffic to the site, therefore prioritising work earlier on will mean that once the busy season rolls around, our new content has already been indexed and is more likely to drive sessions and, ultimately, conversions and revenue.
Making everything formulas and variables
As discussed earlier, having a forecasting model which is flexible and adaptable is really important in order to map out different scenarios. Our forecasting model is based on formulas that allow us to do exactly this.
This allows us to answer questions such as:
- What if we improved the conversion rate?
- What if we frontloaded our budget?
- How would our forecast change if the client’s in-house team took control of the content copy production? Or how would it look if we split this 50/50?
- What is the difference in sessions/conversions with different levels of budget?
- What if we focused on technical SEO initially at the cost of content production?
- What would the model look like if we adjusted the confidence intervals?
What we mean here is, there are probably 10 different things a consultant needs to update manually when changing our forecast. Everything else is totally formula based. There’s no manual copy-pasting of data from one tab to another. It was pretty hard to wrap our heads around some of the array formulas we needed to use, though we were able to call upon Aira’s AI Google Sheet formula helper, ‘make me a formula’, at times for inspiration.
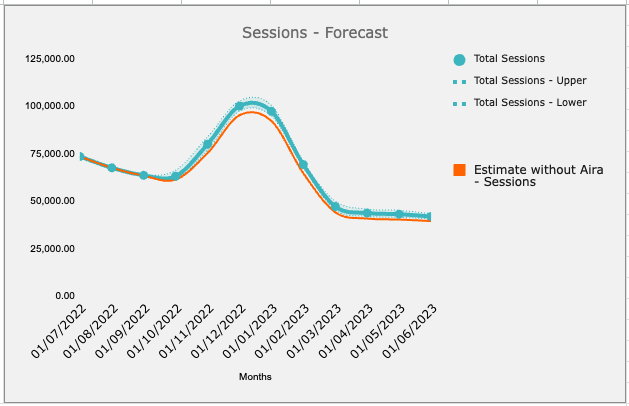
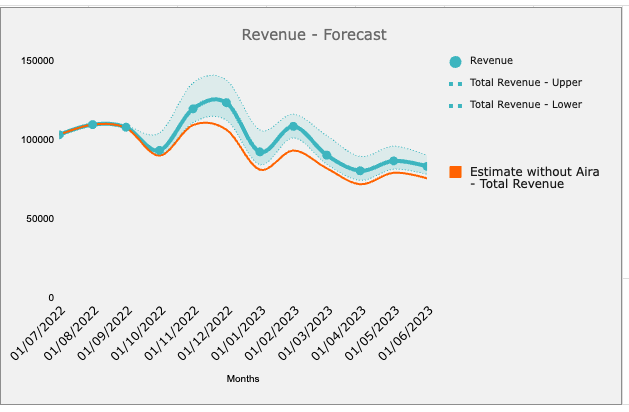
Presenting the forecast with confidence intervals
When presenting the results of the forecast, it’s important to clearly communicate:
- The number we’re sharing isn’t the only possible outcome
- What a best case scenario looks like
- What a worst case scenario looks like
Making the upper and lower bounds on the line graph below was a challenge in itself, but suffice to say it’s all created entirely in Google Sheets. We’ll share how we did it in another post!
To wrap it up
The way that we approach SEO forecasts is a blend of historical data and estimates of how much incremental traffic we can bring based on how much of a total addressable market we are able to claim.
There are plenty of elements that play a role in forecasts and are a combination of using the existing data, adding in business intelligence and making decisions, and mapping out different scenarios about the schemes of work.
